Research Low-Income Energy Affordabilty Issues
The Baseline - County & State Data & Analysis
Each state's annual Home Energy Affordability Gap is calculated on a county-by-county basis.
Within each county, the affordability gap is calculated for individual segments of the low-income population.
The total Home Energy Affordability Gap for each state is then aggregated by weighting each low-income segment within each county.
The County & State Home Energy affordability gap data is the baseline from which all of the Affordability Gap applications are derived.
It is available for download on a no-charge basis to support and assist further research into low-income energy affordability issues.
The complimentary County & State package includes the elements described below.
State Affordability Gap Fact Sheet
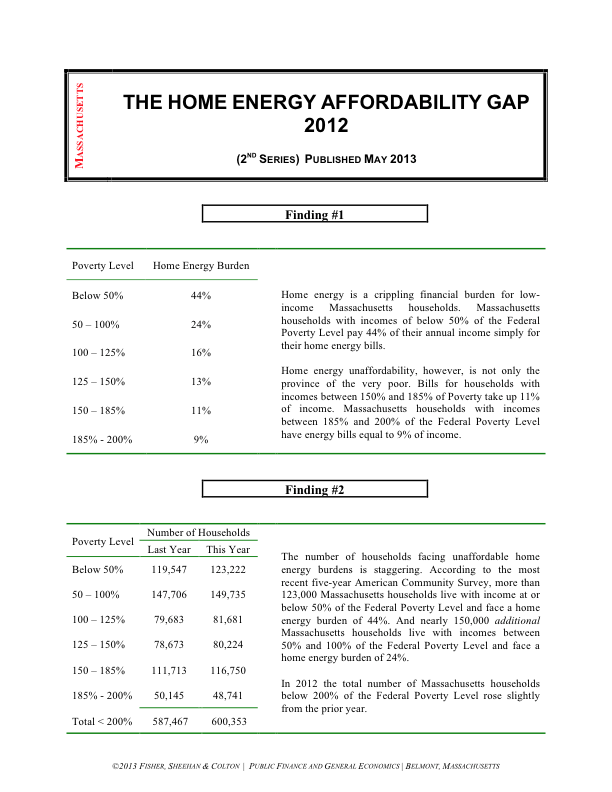
The State Home Energy Affordability Gap Fact Sheet is the flagship of FSC's Affordability Gap analysis. Each State Fact Sheet presents six findings which highlight trends in that state's Affordability Gap circumstances. The 2nd Series Home Energy Affordability Gap analysis places renewed emphasis on how the current year data compares to the prior year. Findings are presented on the follow elements:
- The trend in home energy burdens (household energy bills / household income) broken down by segments of the low-income population;
- The number of households within each segment of the low-income population;
- The state's Home Energy Affordability Gap index (comparing the current Afforability Gap with the base year);
- A comparison of the state's aggregate annual Affordabilty Gap in dollars with the state's allocation of LIHEAP dollars;
- An analysis of the primary low-income heating fuel by tenure; and
- The trend in prices of the various fuels used for home energy.
State Affordability Gap Dashboard
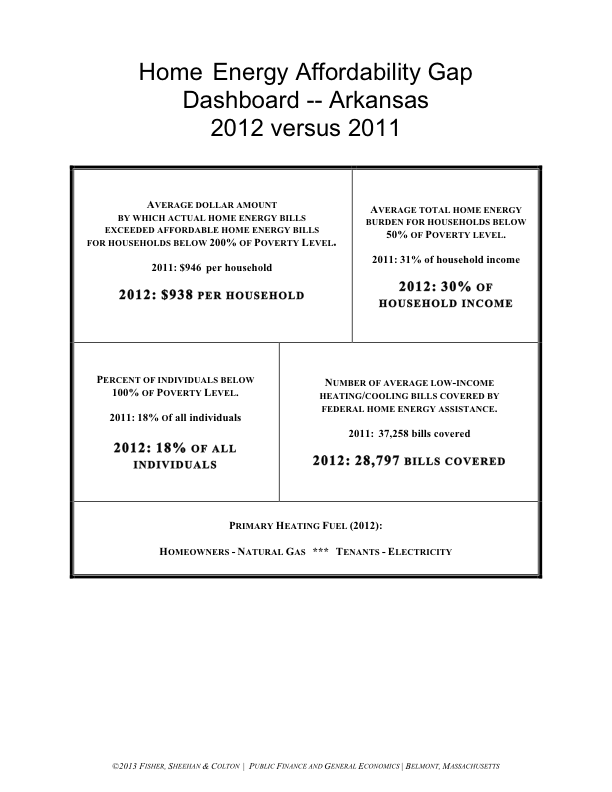
The State Affordability Gap Dashboard provides an "at-a-glance" synopsis of that state's affordability gap circumstances and how those circumstances have changed from the previous year. The following elements are included on the Dashboard:
- The trend in the household Home Energy Affordabiity Gap for all households at and below 200% of the Federal Poverty Level;
- The trend in home energy burdens (household energy bills / household income) for households at and below 50% FPL;
- The number of individuals within the state at and below 100% FPL;
- The trend in the number of low-income heating &cooling bills "covered" by federal energy assisance; and
- An analysis of the primary low-income heating fuel by tenure.
County Level Data Tables
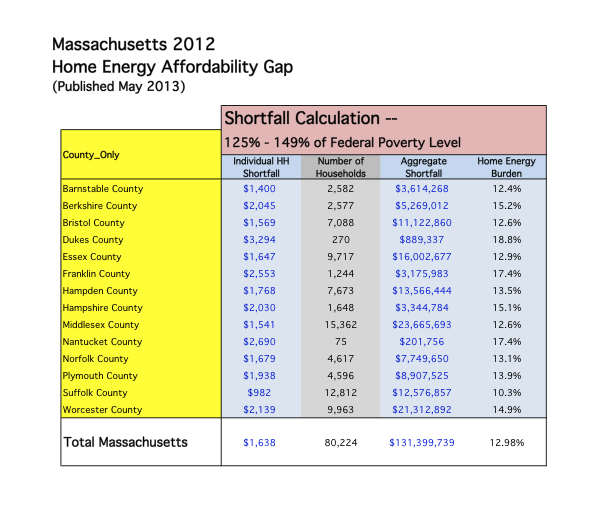
The County Level Data Table displays Home Energy Affordability Gap information for each county within the state. Affordability Gap information is calculated for all households with income less than 200% of the Federal Poverty Level as well as the following individual segments of the low-income population:
- Less than 50% of the household Federal Poverty Level
- 50%-100% FPL
- 100%-125% FPL
- 125%-150% FPL
- 150%-185% FPL
- 185%-200% FPL
The following data is provided for each county and each segment of the low-income population within the state. State-level totals are also presented:
- The annual household Affordabilty Gap in dollars;
- The number of households in this district and low-income segment;
- The aggregate annual Home Energy Affordabilty Gap for this district and low-income segment in dollars; and
- The annual household energy burden (household energy bills / household income).


