What Is the Home Energy Affordability Gap ?

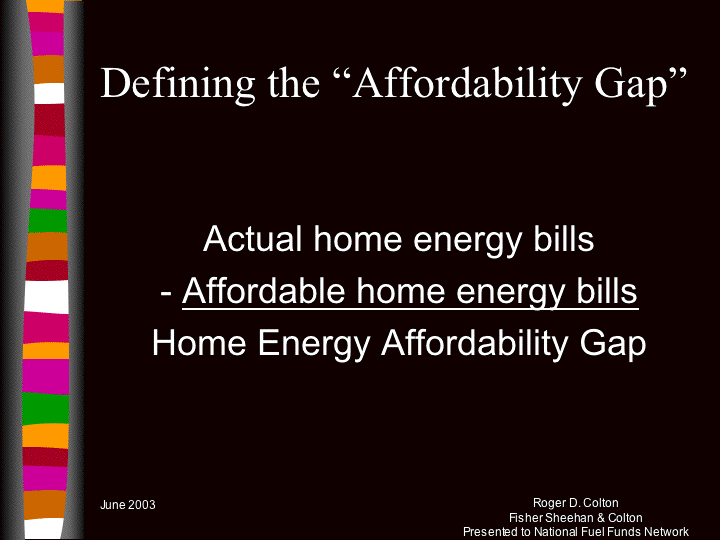
In an effort to quantify the gap between "affordable" home energy bills and "actual" home energy bills, Fisher, Sheehan & Colton (FSC) developed a model that estimates the "home energy affordability gap" on a county-by-county basis for the entire country.
Introduced in April 2003 (using 2002 energy prices), FSC found in that initial Home Energy Affordability Gap analysis that the annual "affordability gap" reached roughly $18.2 billion and that federal fuel assistance provided through the Low-Income Home Energy Assistance Program (LIHEAP) covered just a fraction of that gap. Updates of the Home Energy Affordability Gap have been published annually.
The 2012 Home Energy Affordability Gap, published in May 2013, introduces the 2nd Series of FSC's annual Affordability Gap analysis. The 2012 Home Energy Affordability Gap going forward cannot be directly compared to the Affordability Gap (1st Series) for 2011 and earlier years. While remaining fundamentally the same, several improvements have been introduced in both data and methodology in the Affordability Gap (2nd Series).
The most fundamental change in the Home Energy Affordability Gap (2nd Series) is the move to a use of the American Community Survey (ACS) (5-year data) as the source of foundational demographic data. The Affordability Gap (1st Series) relied on the 2000 Census as its source of demographic data. The ACS (5 year data) offers several advantages compared to the Decennial Census. While year-to-year changes are smoothed out through use of 5-year averages, the ACS nonetheless is updated on an annual basis. As a result, numerous demographic inputs into the Affordability Gap (2nd Series) will reflect year-to-year changes on a county-by-county basis.
1 - Actual Home Energy Bills
In addition to residential energy prices, home energy bills are a function of the following factors:
- Energy use intensities (by fuel and end use)
- Tenure of household (owner/renter)
- Housing unit size (by tenure)
- Household size (by tenure)
- Heating fuel mix (by tenure)
- Heating Degree Days (HDDs) and Cooling Degree Days (CDDs) (by county)
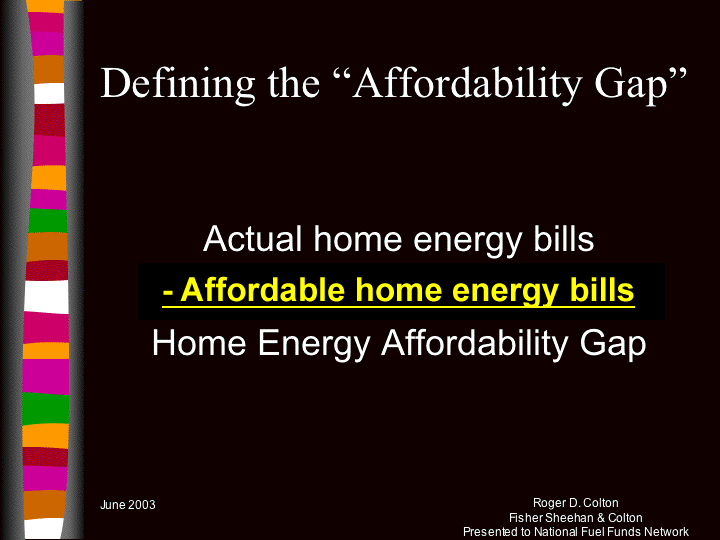
2 - Affordable Home Energy Bills
The "affordable burden" for home energy bills is set at 6% of gross household income for the Home Energy Affordability Gap model. This burden takes into account the total cost of shelter and the proportion of total shelter cost devoted specifically to energy.
The "affordable burden" for home heating and cooling is set at 2% of gross household income.
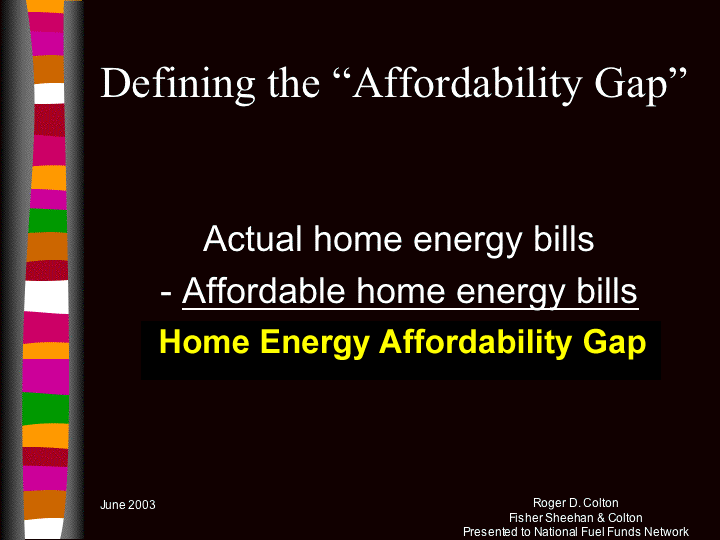
3 - The "Gap"
Each state's annual Home Energy Affordability Gap is calculated on a county-by-county basis. Within each county, the affordability gap is calculated for individual segments of the low-income population as follows:
- Less than 50% of the household Federal Poverty Level
- 50%-100% FPL
- 100%-125% FPL
- 125%-150% FPL
- 150%-185% FPL
- 185%-200% FPL
The total Home Energy Affordability Gap for each state is then aggregated by weighting each low-income segment within each county. Other aggregations are possible and useful. In fact, Home Energy Affordability Gap data can be aggregated for any geographical area described as a list of counties or zipcodes (e.g. legislative districts and utility service territories).


